Network Center

The Network Center scans your connected DE network and shows a full monitoring summary in real time.
It provides live visibility into generation, consumption, storage, and overall network health.
Machine Information
Setting
Value
Energy Capacity
800,000 DE
Energy Consumption
400 DE per scan cycle
Base Processing Rate
8,000 DE/t
Scan Interval
~2 seconds
Network Safety Limit
4,096 nodes
Overclockable
Machine UI
Usage Examples
| Setup | Result |
|---|---|
| Connected mid-size network | Live overview of production/consumption |
| High-capacity factory grid | Stored energy, free space, and status indicators |
| Large network near 4,096 nodes | Truncation/performance warning visibility |
Practical notes
- Use the panel to compare supply, demand, and stored energy.
- Keep some DE available so scan cycles do not stop.
- Very large networks may be truncated by the safety limit.
Crafting Recipe
▸ Crafting ingredients in text
Network Center
Recipe result: utilitycraft:network_center
Total ingredients
- Glass (
minecraft:glass) ×2 - Comparator (
minecraft:comparator) ×1 - Machine Case (
utilitycraft:machine_case) ×2 - Steel Ingot (
utilitycraft:steel_ingot) ×1 - Titanium Plate (
utilitycraft:titanium_plate) ×2 - Ultimate Chip (
utilitycraft:ultimate_chip) ×1
How It Works
- Place and connect the machine to your energy grid.
- Keep DE available for periodic scanning.
- Open the interface to inspect generation, consumption, and network status.
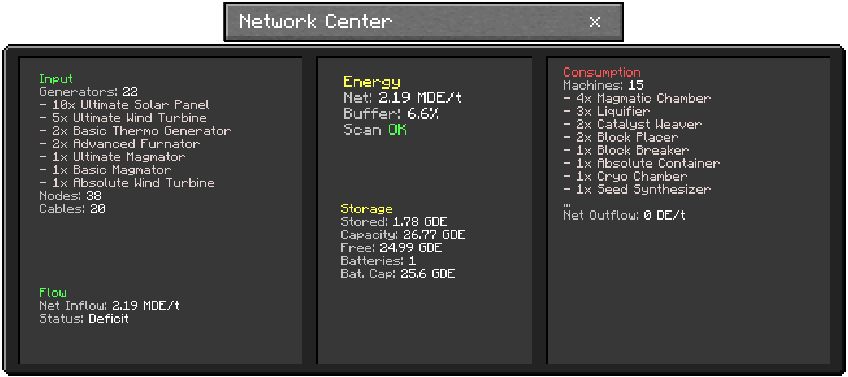
Reading the display
- The display separates generation, consumption, storage, and overall status.
- Use it to compare current production against demand and free capacity.
Panel Data
- Machine and generator counts
- Battery and cable counts
- Stored energy, total capacity, and free space
- Net energy flow and overall status (Stable, Charging, Draining, Deficit, Buffer Full)
Performance Notes
- The scanner consumes energy continuously while active.
- Very large networks can trigger safety truncation warnings.